Physics Behind the ECG
The Limb Leads

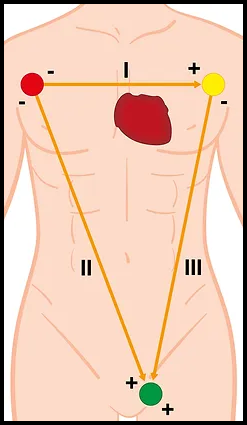
Coloured dots represent points of lead attachment points, the three traces are noted in the second diagram (I, II & III)
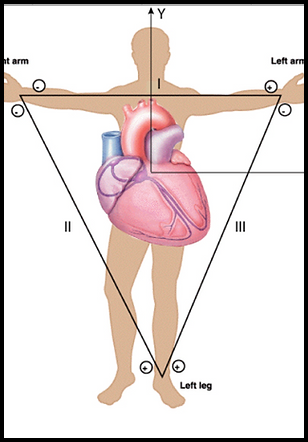
The limb leads are placed on all 4 limbs. Look at the diagram. The coloured dots represent the points that the limb leads measure electrical activity at.
NOTE: the black limb lead on the right foot is not shown in the diagram. This is the earthing lead and it gives a reference point for the other leads. It doesn't actually measure anything.
Each coloured point 'looks' towards another and measures if there's any depolarisation in that direction.
Any depolarisation that happens along one of these lines towards the +ve end will appear as an upwards deflection on an ECG trace in that lead. Any depolarisation that happens in the opposite direction will appear as a downwards deflection.
Traces on the ECG
- Depolarisation going between red dot and yellow dot appears on limb lead I tracing
- Depolarisation going between red dot and green dot appears on the limb lead II trace
- Depolarisation going between yellow dot and green dot appears in limb lead III tracing
It is important to know what is meant by the words depolarisation and repolarisation. In simple terms depolarisation describes the electrical signal discharging and spreading through the certain tissues, and repolarisation describes the tissues charging back up again like a battery.
The heart tissues do this by themselves spontaneously and the rate of this can be controlled by inputs from different nerves and by the sinoatrial node.
A depolarisation will cause a contraction of that part of the heart muscle. A repolarisation happens as that part of the heart relaxes again.