Cardiac Axis
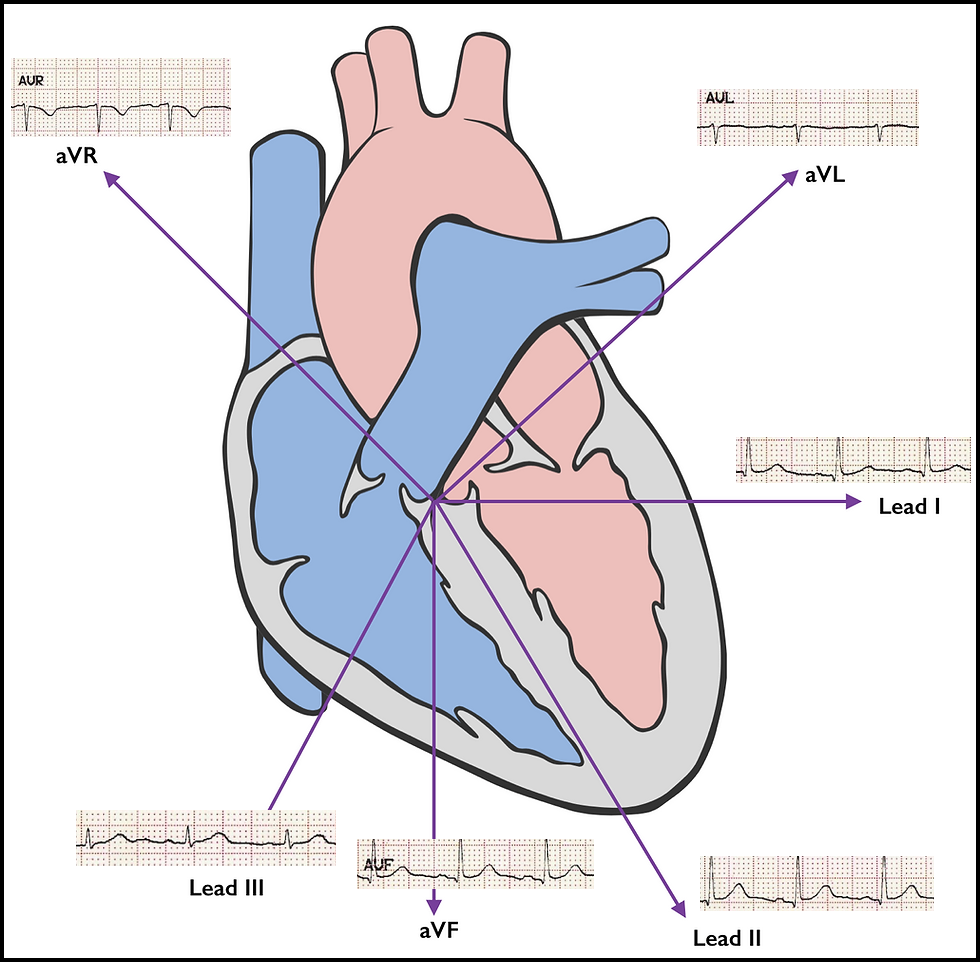
So far the tutorial has focused on limb lead II but the other leads are just as important. What they offer are different views of the spread of electrical activity through the heart and each lead has a characteristic appearance.
In order to understand this more clearly we need to understand what is meant by cardiac axis.
General Direction of Depolarisation
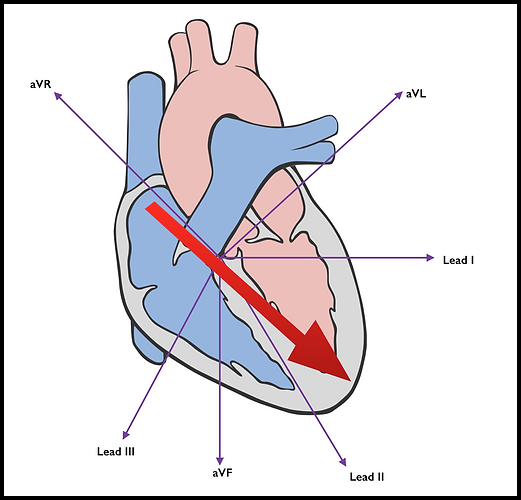
The red arrow in this diagram represents the general direction of depolarisation in a normal heart. This is called the cardiac axis and in a healthy person runs in the direction from 11 o'clock to 5 o'clock.
Look how the axis runs close to parallel with limb lead II and aVR. This means those leads will have the largest amplitudes.
However the cardiac axis is going in the opposite direction to aVR. This means that depolarisation going from 11 o'clock to 5 o'clock will appear as a negative deflection in the aVR reading. This is what happens in a normal heart.
As long as the vector of depolarisation runs between lead I and aVF then the axis is considered normal.
The Views From the Leads
Depolarisation running along parallel to the line of a lead appears as a deflection on the tracing for that lead.
Depolarisation going at 90 degrees to a lead's line will not show on that lead.
Depolarisation going in the opposite direction to the arrows will appear as a negative deflection in that lead (e.g. aVR).
Observe How a Normal Tracing Appears In Each Lead