Timings on the ECG
The X-axis of the ECG corresponds to time and the Y axis to voltage.
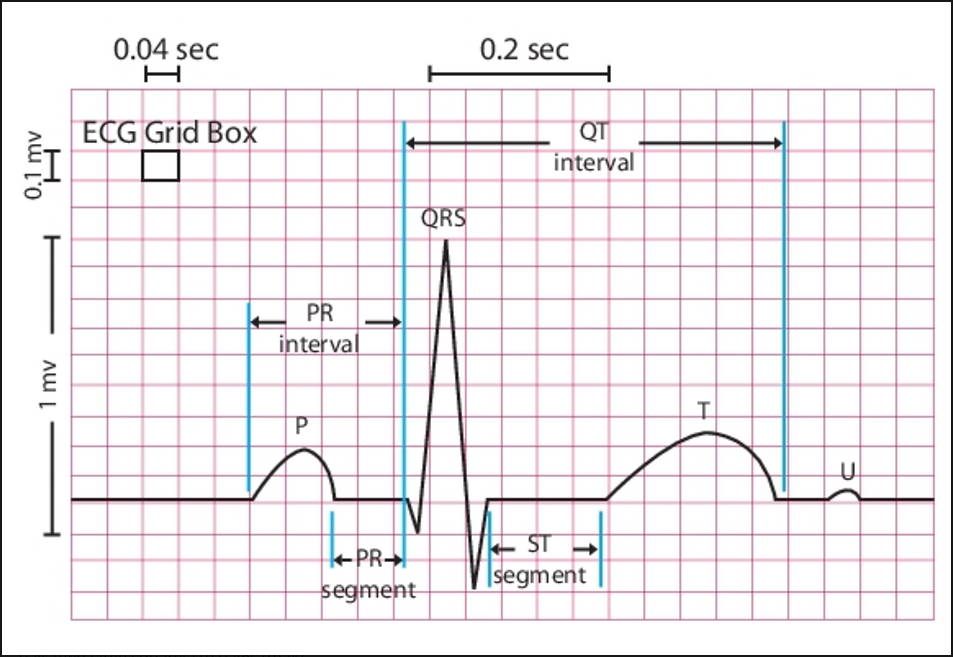
- Each large square on the graph corresponds to 0.2 seconds. Hence 5 large squares is 1 second
- Each small square on the graph corresponds to 0.04 seconds hence 5 small squares make a large square
- Check the timing of each of the components of the ECG wave to make sure they are the correct length
PR Interval
0.12 to 0.2s (one large square)
QRS Complex
Less than 0.12s (three small squares)
QT Interval
0.4s (two large squares) to 0.46s (max)

Zoomed Out View
Here you are able to see the size of the large squares on the trace.
Each of these squares corresponds to 0.2 seconds.
The large squares are made of 5 smaller squares in length.
Each of the small squares represents 0.04s in real time.

Zoomed in View
This image shows a zoomed in view with the normal length of each of the wave components showing.
The squares in this image are the small squares each representing 0.04s.
Five of these small squares would form one large square (shown on the zoomed out image).
