What are the Main Concentration-time Relationships? - Zero-order Kinetics

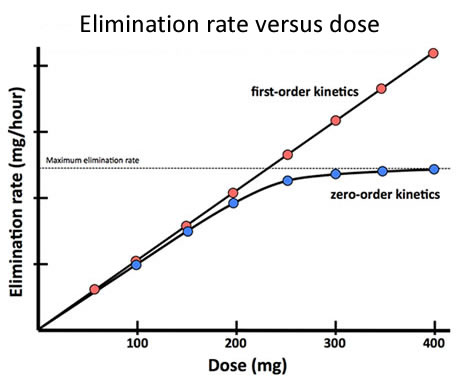
Fig 12 Graph of rate of elimination against drug dose for drugs displaying first-order kinetics and for those displaying zero-order kinetics to show effect of linear increases in dose upon elimination rate. In zero-order kinetics the dose increments eventually produce a drug concentration sufficient to saturate the metabolising enzymes, at which point the rate of elimination can rise no further.
Some drugs are metabolised by enzymes of limited capacity that are saturated by therapeutic doses. Two important examples are:
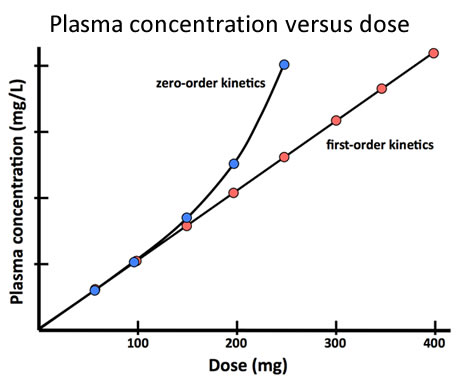
- Ethanol (ethyl alcohol). After low doses the rate of metabolism by alcohol dehydrogenase increases with increasing doses, but as the dose is increased further, or if the same dose is repeated too often before the first has been eliminated, the enzyme capacity is saturated and rate of metabolism cannot increase further (Fig 12). As a consequence, the plasma concentration of ethanol, instead of rising in proportion to each dosage increment, increases more and more acutely as the amount remaining to be metabolised increases (Fig 13). Accumulation is rapid and can produce serious toxic effects.
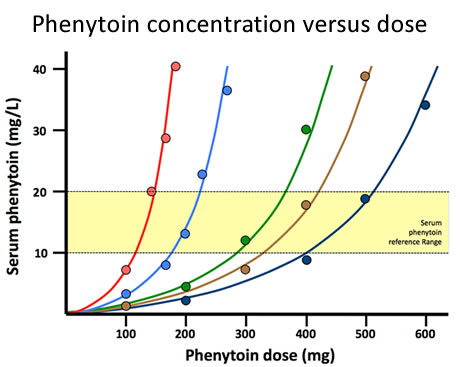
- Phenytoin. As the doses of this common anticonvulsant drug are titrated upwards through the lower range of daily dosages, the rate of metabolism of phenytoin by CYP2C9 increases to match the rise in plasma concentration. With further dosage increments enzyme capacity is saturated and the plasma concentration increases ever more acutely leading to adverse effects. Fig14 illustrates this phenomenon and shows that enzyme capacity (the dose at which saturation occurs) varies between individuals.
The kinetics of capacity-limited metabolism are described by the Michaelis-Menten equation:
Rate of elimination = Vm.[C/(Km + C)]
Where Vm is the maximum rate of metabolism, Km is the Michaelis constant and C is the concentration of unbound drug in plasma.


